
Peer Insight. Measurable Outcomes.
The Best Leaders Don’t Lead in Isolation.
Study Groups gives leaders trusted peer insight and benchmarking to make better decisions and drive measurable outcomes.




Trusted by 775 members across 335 unique independent operating firms
Our Verticals
Built for business leaders in your industry
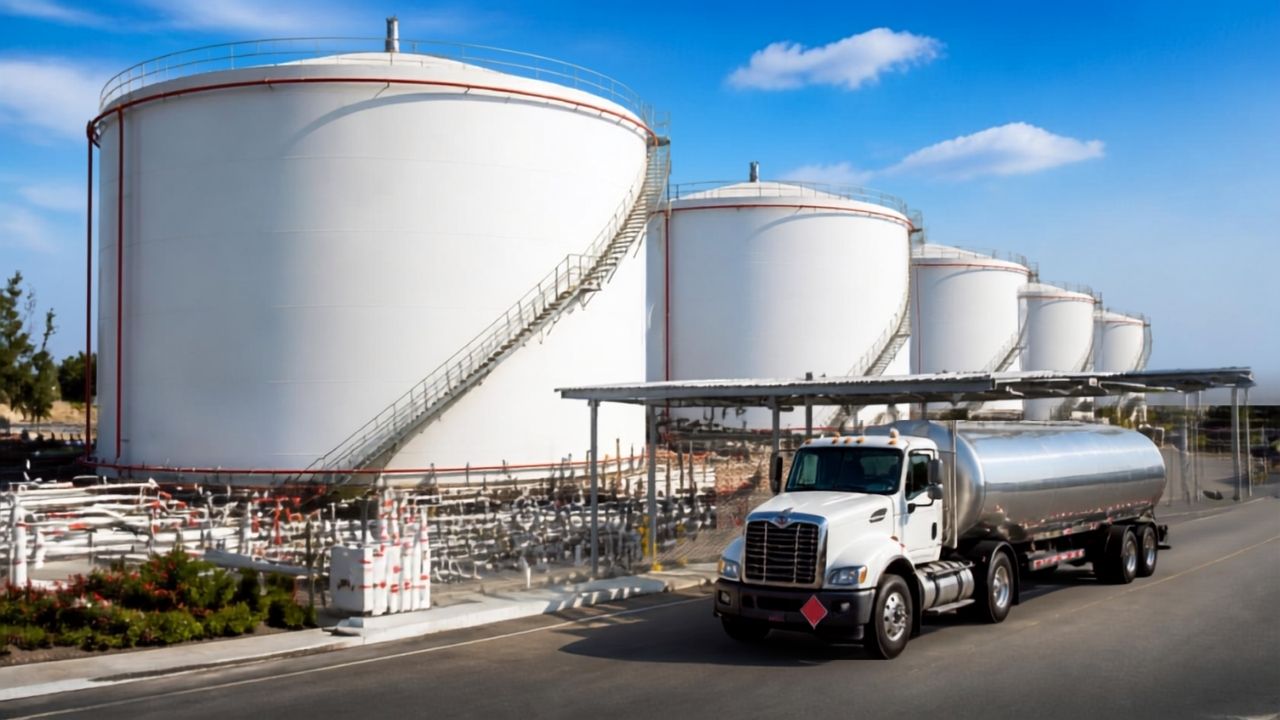
Energy
- Petroleum
- C-Stores
- Propane and Lubricants
- Wholesale (Dealer) Fuel Supply
- Commercial and Agriculture Fuel Supply
- Fuel Transportation

Construction
- General Contractor
- HVAC
- Solar
- Ready Mix

Retail
- Convenience Retail
- Car Wash
- Foodservice

Convenience Distribution
- Best-in-Class Distributors

Verified results – 41 years of member data
Performance backed by four decades of numbers
+135%
Gross Profit Growth
Gross profit growth over 10 years ($27.7M to $65.8M vs. less than 65% GDP growth)
9%
Gross Profit
Collectively, Study Groups members grew gross profit at 9% a year, compounded, against 4.8% for the U.S. economy. 1.6x faster over a full decade.
5.4%
Year One GP Growth
Gross profit growth in year one of membership
13.7%
Year Two Cumulative GP
Cumulative gross profit growth by year two
The Study Groups Edge Insight Ecosystem
Where industry leaders benchmark, learn, and grow together.
Proprietary benchmarking
Benchmark performance and uncover growth opportunities.
Peer insight
Peer-driven insights that help you make better business decisions.
Trusted relationships
A trusted network of industry leaders.
Member-built solutions
Members identify the need. We build the solution.
Verified results
9% gross profit growth per year, compounded
1.6 times faster than the broader economy over a full decade.
$95M
Combined EBITDA increase per year across a single peer group over seven years
3x
Owner equity growth over 10 years vs. less than 65% nominal GDP growth over the same period
+125%
Adjusted earnings before tax since 2015, outpacing the Employment Cost Index
12–20%
Annualized average ROCE vs. 7.5% typical cost of capital
“Over the seven years our group has been together, our combined EBITDA has increased by $95 million per year.”
775 members · 335 unique firms · 41 years of proof
See how your numbers stack up
Top performers already know where they stand.