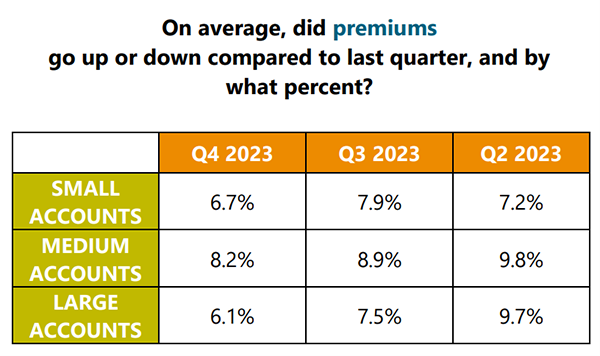
Businesses are continuing to see significant premium increases on many of their insurance lines. Data gathered by the Council of Insurance Agents & Brokers (CIAB) shows that the fourth quarter of 2023 was the 25th consecutive quarter of overall rate increases with the average increase being 7%. For the last three quarters medium-sized accounts with an insurance spend in the $250k to $1 million range have had the largest percentage increase and were up 8.2% for the most recent quarter (see table).
Table 1: 2023 quarter to quarter premium comparison

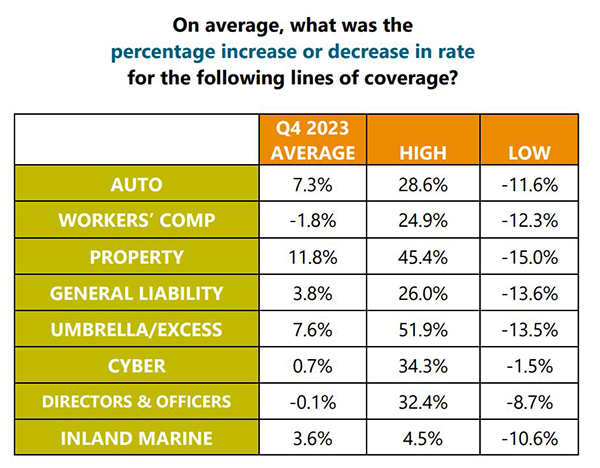
Table 2: 2023 comparison by line of coverage

By line of coverage the biggest premium increase was for property, up 11.8%, followed by umbrella/excess at 7.6%, and auto at 7.3%. There were smaller increases for general liability up 3.8%, inland marine up 3.6%, and cyber up .7%. The survey showed slight decreases in average premium rates of .1% for directors & officers’ insurance and of 1.8% in worker’s compensation. These averages mask the considerable variation in rates experienced by individual companies as the accompanying table shows:
While businesses often feel there is not much they can do to control insurance costs, some companies have taken matters into their own hands. At the urging of our members, Study Groups explored the formation of an insurance captive. In 2016 Holmes Murphy, Study Groups, and Innovative Captive Strategies (ICS) came together to build a captive insurance solution tailored for the unique needs of Petroleum/C-Store companies. The result was the formation of the Fairhaven Captive that provides “best-in-class” Petroleum/C-Store companies the opportunity to have ownership in a leading-edge insurance company that is razor focused on operational excellence and safety results. Since its start in 2017, Fairhaven has grown from 7 member companies to 38. Lines covered by Fairhaven include worker’s compensation, general liability, liquor liability, and auto liability and physical damage.
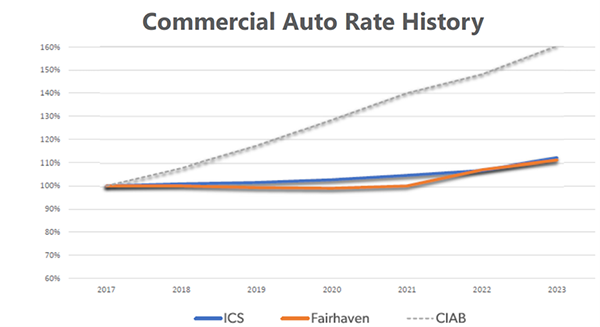
The graph below shows the six-year trend of auto premium increases for the industry as a whole, as reported by CIAB and for the Fairhaven Captive as well as other insurance captives managed by ICS. If you are not presently part of an insurance captive, you might want to explore the potential for your company. Companies that make the best fit for a captive want to improve their safety culture and be open to continuous improvement as they share with other members ideas for operational excellence and together reap the financial rewards from risk reduction.
Figure 1: Commercial auto rate history


