We are often asked how Study Group member returns compare to firms in the larger economy. Study Group members actively benchmark against their peers. Members share ideas and offer one another constructive input. They help hold each other accountable. A contention is members should be able to generate superior returns through actively engaging in the Study Group process. But do they? The answer is yes.
The San Francisco Federal Reserve Bank published a recent article in their Economic Letter by Bobrov, Davis, Sollaci, and Traina titled “Why are Overall Profits Outpacing Financing Costs?” The authors in the article calculate average EBITDA Returns on Capital for 1) all firms in the US economy 2) publicly-traded firms and 3) privately-held firms. To see how our Study Group members compared, we calculated EBITDA Return on Capital using the same methodology for 95 same-Study Group members who have been involved in a group and reported data for the last 10 years.
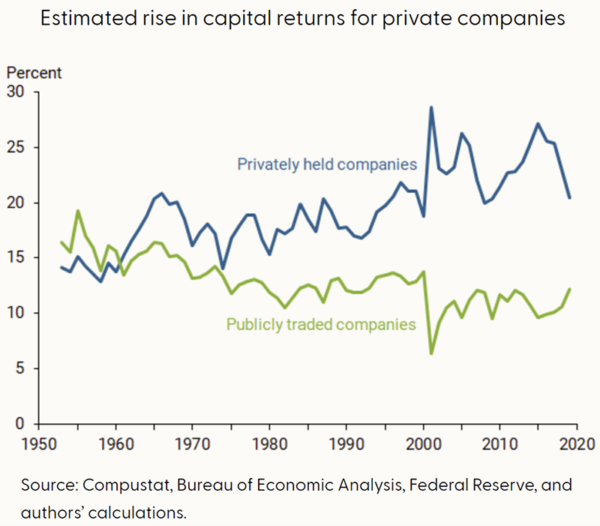
Figure 1 shows EBITDA Return on Capital broken out for privately-held companies and publicly-traded companies from 1950-2020 from the San Francisco Fed article. The authors observe privately-held companies have outperformed publicly-traded companies in recent decades. The reason is not fully understood. The authors speculate that perhaps there is a market power advantage that privately-held companies exhibit on average (I doubt it), or that perhaps fewer regulations and longer investment horizons allow privately-held companies to take on and justify more risk. Causation aside, over the last decade, privately-held US companies have averaged an approximately 22% EBITDA return on capital and publicly-traded companies have averaged about an 11% EBITDA return on capital. Economywide (not shown) EBITDA returns on capital have averaged roughly 15%.
Figure 1: Estimated rise in capital returns for private companies

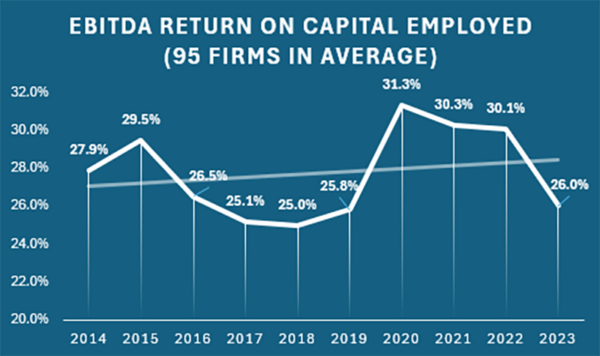
Figure 2 shows our 95 same-Study Group member returns between 2014 and 2024. Study Group members have averaged about 28%.
Figure 2: EBITDA return on capital employed

Table 1: Comparison Study Group vs non-Study Groups firms
| Firm | 10-Year Average EBITDA Return on Capital |
|---|---|
| All Firms in US Economy | 15% |
| Publicly Traded Companies | 11% |
| Privately Held Companies | 22% |
| 95 Same Industry Study Group Members | 28% |
This table provides a quick summary. It is possible Study Group member outperformance is related to the industries we serve, and it is the industry that is outperforming other US firms more so than it is our members. The 95 Study Group members, however, have a varied mix of businesses: propane, lubricants, cardlocks, dealers, convenience stores, car washes, quick serve restaurants, real estate, etc. Each of these segments is subject to some of its own market forces, supplier relationships, technology, and regulation. Moreover, additional research we have done shows 1) our Study Group members tend to outperform the others in their industries and 2) long-time Study Group members tend to outperform relatively new Study Group members. These data points taken together suggest there likely is considerable power in the Study Group process.
Most importantly, whatever the cause of the outperformance, it is great to see our Study Group members performing so highly compared to other firms.

