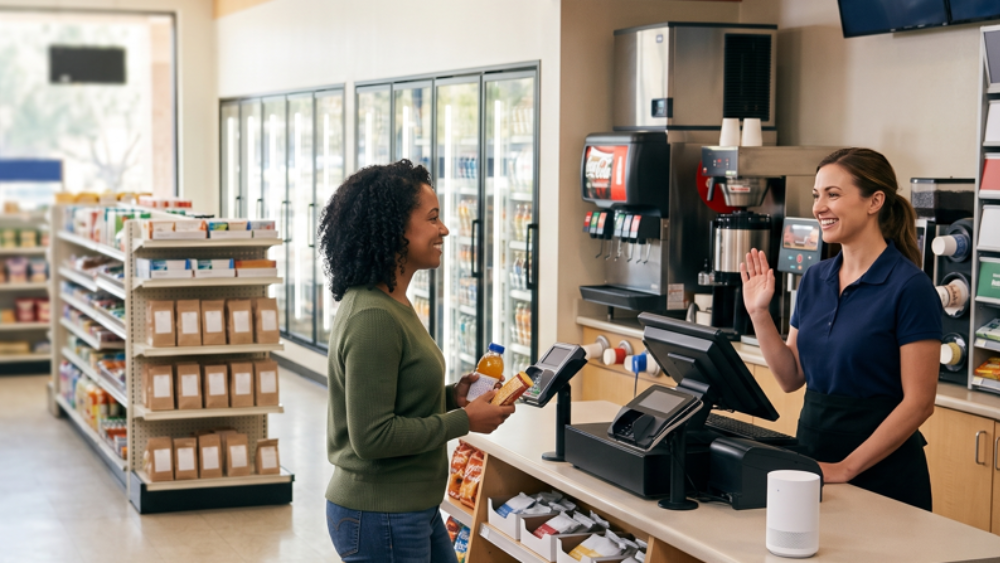
One client recently demonstrated the value of connecting executive direction with frontline behavior. The strategy was deliberately simple: get back to the basics, greet every customer, and thank every customer.
During the following two months, the client’s overall customer service score rose from 55% to 64%. That represents a nine-percentage-point gain and a 16.4% relative improvement.
The result matters because the client did not rely solely on sending a memo, holding a meeting, or announcing a new service standard. Real-time reporting showed executives whether employees were putting the strategy into practice during actual customer interactions. Leadership gained visibility into where adoption was strong, where execution remained inconsistent, and which locations needed additional attention.
This example raises a broader question: How many customers are standing at your counters right now, waiting to be noticed?
Companies seeking to scale customer service should measure the entire service sequence, starting when a customer enters the service area and ending when the customer leaves.
The recommendation is to track three distinct measures:
- Arrival-to-greeting time
- Greeting-to-checkout time
- Total visit time
Those measures should sit beside basic courtesy behaviors, including whether employees greet and thank each customer. Together, they reveal whether an executive priority has become a consistent frontline behavior.
Measure the Experience, Not Only the Transaction
Most companies already measure sales, labor, transaction counts, and average service time. Those reports describe the final outcome, but they rarely identify where the customer experience changed.
A customer starts forming an opinion before an employee speaks. An unnoticed wait creates one type of frustration. A slow checkout creates another. Both might produce the same total service time, yet each requires a different operational response.
AI-powered in-store technology identifies when a customer enters the service area, timestamps the first employee greeting, measures the interaction, and tracks checkout and departure. The platform organizes those signals by store, shift, and daypart. Instead of reviewing one blended number, leadership sees each stage of the customer journey.
Consider two stores reporting the same 90-second average service time:
Store A: 45 seconds waiting + 45 seconds checking out = 90 seconds
Store B: 5 seconds waiting + 85 seconds checking out = 90 seconds
The totals match. The service failures do not.
Store A has an acknowledgment problem. Management should review counter visibility, employee positioning, staffing coverage, and expectations around greeting customers.
Store B has a process problem. Management should examine product lookup, point-of-sale configuration, item placement, payment delays, or employee training.
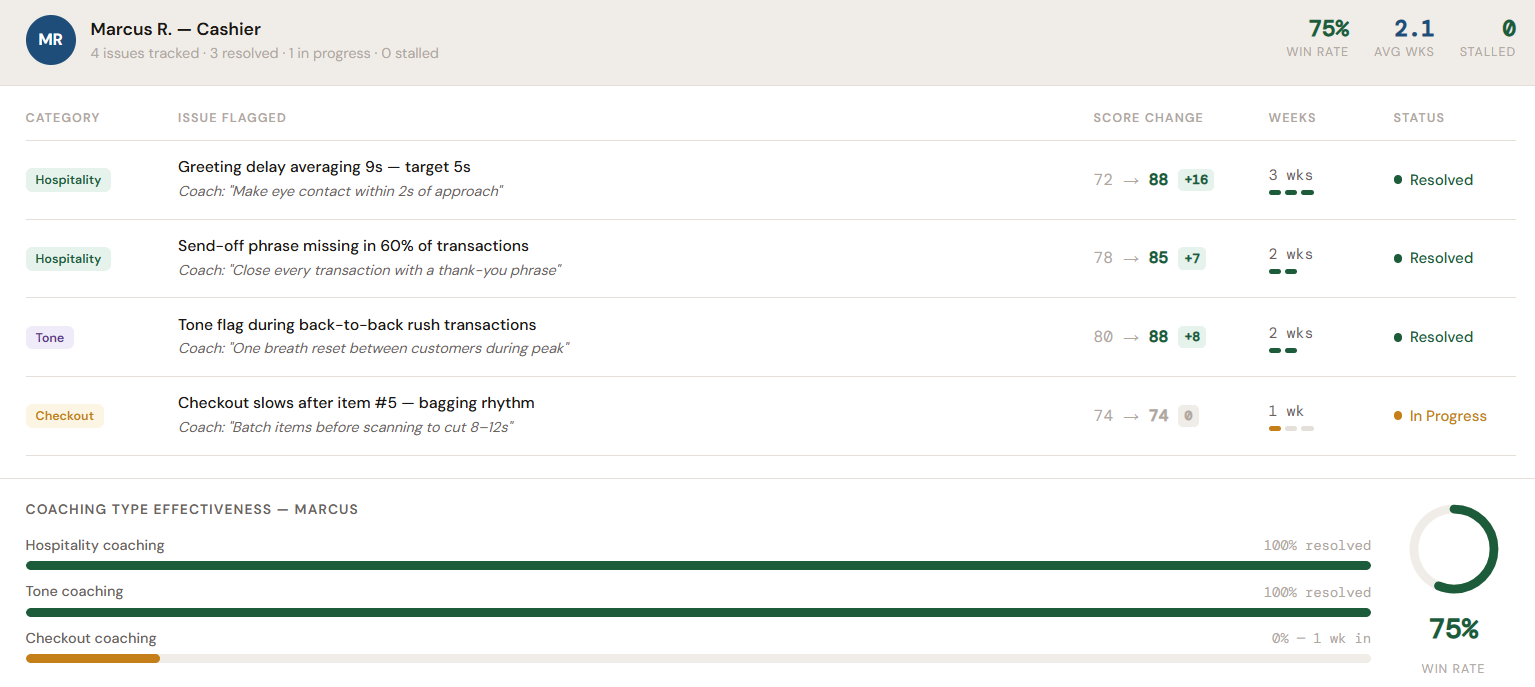
Sending both stores the same instruction would waste time and money. Stage-level data directs each store toward the correct response. See below for an example from a Pythia Scorecard dashboard, showing one cashier’s scores in four different customer service areas – highlighting strengths and revealing coaching opportunities.
Small Delays Become Large Problems
Small delays become significant when multiplied across an entire organization. Consider a company with 50 stores serving 500 customers per location each day. The company handles 25,000 daily visits.
If every visit includes a hidden 30-second delay, customers collectively spend 750,000 seconds waiting each day. That equals 12,500 minutes, or more than 208 customer-hours every day. If the pattern continues throughout the year, the company accumulates more than 76,000 customer-hours of unnecessary waiting.
Those numbers turn a seemingly minor service delay into an executive-level operating issue. They also give leadership a measurable reason to prioritize staffing, workflow, training, and technology improvements.
The same principle applies to basic courtesy. Missing one greeting might appear insignificant. Repeating the same behavior across hundreds of employees and thousands of daily interactions produces a much larger effect on customer perception. The client’s 16.4% improvement shows what might happen when leadership establishes a simple expectation and gains visibility into frontline execution.
Create a Measurable Feedback Loop
Executives frequently establish priorities with clear intentions, but those priorities pass through several layers before reaching frontline employees. Language changes, urgency fades, and local habits take over. By the time a customer walks into a store, the original strategy might no longer be visible.
Real-time operational data closes this gap. Leaders establish an expectation, observe the corresponding frontline behavior, and track the customer service outcome. In the client example, management emphasized greeting and thanking customers. The platform measured whether those behaviors occurred, while the customer service score showed the broader result.
A practical operating rhythm follows three steps: measure, diagnose, and verify.
First, measure the baseline for each service stage and courtesy behavior. Second, diagnose where performance breaks down by location, shift, or daypart. Third, implement a targeted response and verify whether the intended measure improves.
After a staffing adjustment, leadership should examine arrival-to-greeting time. After a point-of-sale update, leadership should examine checkout duration. After introducing a greeting and thanking initiative, leadership should track employee adoption and the customer service score. Each investment receives a defined measure of success.
The information should also match each leader’s responsibility. Executives need company-wide trends and comparisons. District managers need location-level exceptions and changes over time. Store managers need specific behaviors their teams should improve during the next shift. Relevant reporting turns customer service data into daily operating guidance.
Scaling the Human Side of Service
The implications reach far beyond faster checkout. Leadership directs labor, training, technology, and capital toward the true source of customer friction. Store teams receive clearer expectations. Executives gain evidence showing whether their strategies are reaching frontline employees and influencing customer interactions.
Most importantly, technology does not replace personal service. It helps companies deliver the fundamentals more consistently. A greeting tells customers they have been noticed. A sincere thank-you ends the interaction with appreciation.
Those behaviors are simple. Maintaining them across thousands of employees and millions of customer interactions is not. AI-powered in-store technology gives leaders the visibility needed to reinforce the basics, measure execution, and scale meaningful human moments across every store.