By Dr. David Nelson
As we wrap up another year, our thoughts turn to the year ahead and what’s in store for the U.S. Economy. Will we see a continuation of economic growth? Will the labor market strengthen or weaken? What’s the direction for consumer prices and inflation? Normally at this time of year, we would have good trend data on the economy for 2025 which would help in forming opinions about 2026, but the record 43-day Federal government shutdown has left gaps in our understanding of the economy.
Unemployment Rates
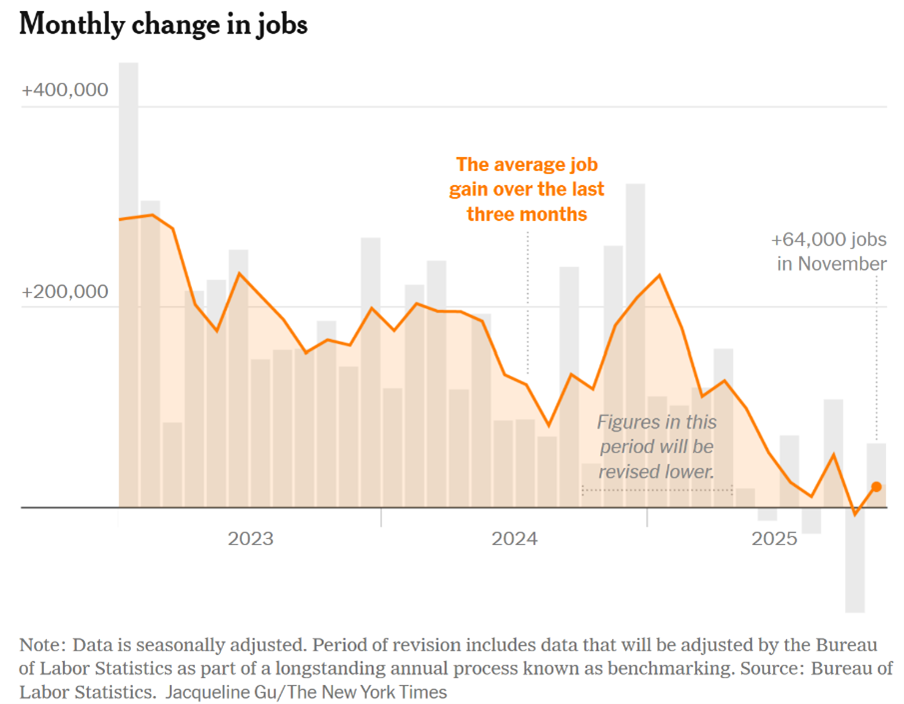
The September jobs report recently released showed that unemployment rose to the highest level in almost four years at 4.44%. Job growth for July and August was reduced downward making overall job growth for the third quarter a modest 62,000 jobs. October unemployment data was not collected but the November report shows a further rise in the unemployment rate to 4.6%, the highest level in four years. Labor supply is slowing because of immigration policy but labor demand is slowing as well. The chart below shows the dramatic reduction in monthly job growth in the U.S. over the past two years.
Inflation
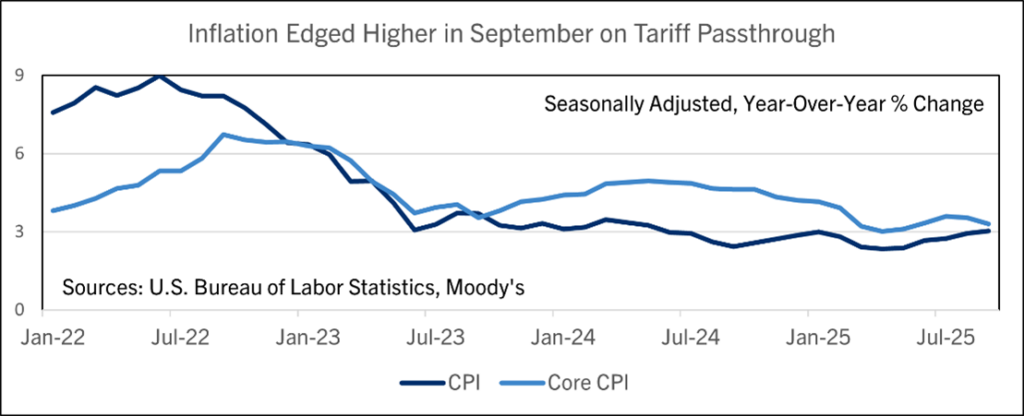
Inflation data for the economy as a whole was not collected for either the Consumer Price Index or the Producer Price Index for the month of October. In September, prices edged higher as the impact of tariffs started to make their way into consumer prices. Donald Trump was elected in part on his platform to reduce prices, which are 25% above 2020 prices. The strong showing of candidates in the November elections who were not endorsed by Donald Trump is a signal that voters were disgruntled by current administration policy.
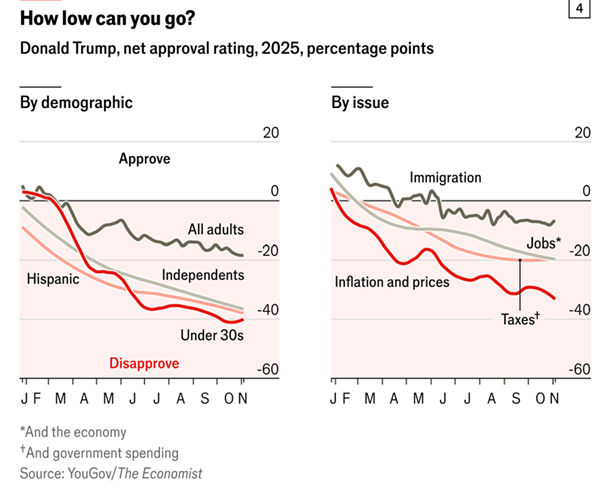
Since Trump’s inauguration in January his overall approval rating has dropped 20%. Among Hispanics, independents, and people under 30, his approval rating has dropped 40%. By issue, his approval rating has dropped the most by his handling of inflation and prices. The impact of tariffs has been to raise prices and to destroy export markets that have taken years to build for US exporters like soybean farmers in the Midwest and apple growers in the Northwest.
Sensing that things are not going well in this regard, Trump recently did a sharp reversal and eliminated tariffs on some key consumer items such as beef and coffee. He has also proposed a cash rebate to American families which if enacted would cost more by far than the additional revenue that has been collected by tariffs. Among middle-income consumers which is broadly defined as those with income of $66k to $200k per year, 44% report being worse off than a year ago with only 23% reporting they are better off.
50-year Mortgage
Another idea that has recently surfaced to help consumers is to move to a 50-year mortgage to boost the demand for housing. Will this make housing more affordable and contribute to the goal of home ownership and wealth creation? I don’t think so. Take a $500,000 mortgage at 6.5%. The monthly payment for a 15-year mortgage is $4,356, a 30-year mortgage is $3,160, and a 50-year mortgage is $2,819. What is the result after 15 years of payments? The 15-year mortgage is paid off, and the equity build up is $500,000 with a total of $283,997 of interest paid.
The 30-year mortgage at year 15 has paid off $137,204 (27.4%) of the loan balance and has paid $431,657 in interest. By contrast the 50-year mortgage at the end of year 15 has only paid off 6.7% of the original loan or $33,343 but has already paid $473,929 in interest. Over the life of the loan a person financing a home on a 50-year mortgage would have paid $1,191,328 in interest compared to $637,722 of interest on the 30-year loan.
So, for saving $341/month on a mortgage payment for a 50-year versus a 30-year loan, a person ends up paying an additional $553,606 in interest, more than the initial mortgage itself. This is not a wealth creation strategy – it is a long-term rental program masked as home ownership.
What’s Ahead in 2026
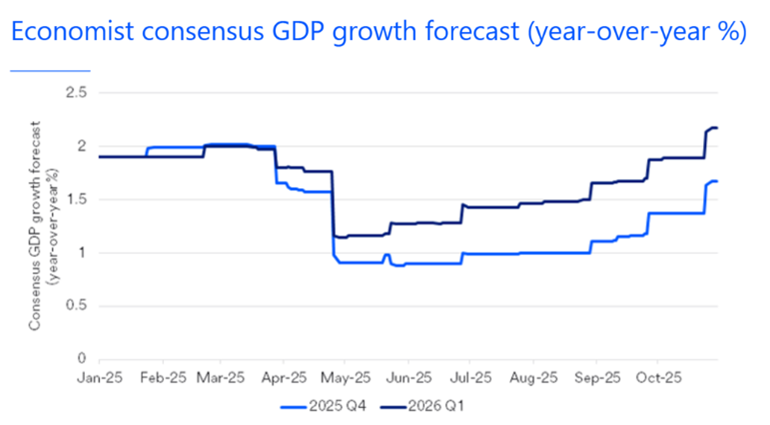
For the economy as a whole, economists see modest growth ahead in 2026 in the 2 to 2.5% range. The accompanying chart shows the drop off in growth projections for the 4th quarter of 2025 and the first quarter of 2026 following the imposition of Trump tariffs in April/May and then the gradual uptrend in these forecasts in the months following.
Helping the economy is the expectation that the Federal Reserve will continue cutting rates by .50 to .75% over the next year. Fiscal policy is expansionary as a result of increased spending and tax cuts at the individual and corporate level. Investment in software, computing equipment, data centers, and electricity generation for AI are big drivers impacting the economy in a positive direction.
The return of 100% bonus depreciation on 15-year life assets like c-stores will be an additional impetus for investment in these sectors.
How are the gains from economic growth distributed in the economy over time? One measure is to look at increases in household wealth. Wealth is highly concentrated in the U.S. with the top 1% of households controlling 30% of the nation’s wealth. To be in the top 1% you would need a household net worth in 2025 of $13.7 million. To be in the top .1% you would need a household net worth of $62 million. For this elite group, their net worth reached $23.3 trillion in the second quarter of 2025, up from $10.7 trillion a decade earlier (this is $13.7 trillion in 2025 dollars). This group has seen a real gain of almost $10 trillion in ten years.
In contrast, the amount of wealth held by the bottom 50% of U.S. households was $4.2 trillion in the second quarter of 2025, up just over 3 trillion in real dollars over the past 10 years. The way one views the economy and its recent economic performance will undoubtedly be impacted by one’s own economic welfare.