
Many Study Group members know their numbers well. They review financial statements every month, watch their margins closely, and can tell you how this year compares with last. Knowing your own numbers is valuable, but it’s even more valuable to see how your numbers stack up against similar businesses. This is where peer-to-peer benchmarking is most useful.
A margin or return on capital can look perfectly reasonable on its own and still trail what comparable operators are earning. Alan Meyer, CEO of Meyer Oil, described it this way: “Putting our financials side by side with operators of equivalent size shows us quickly where we’re strong and where we’re leaving money on the table.”
Looking at results over several years adds one more layer. A single year gives you a snapshot, but a trend shows whether the business is gaining ground or slipping, and it matters most when you compare it with your peers’ trend. A company can steadily improve its return on capital and still fall behind if similar operators are improving faster.
For example, Figure 1 compares hypothetical Company B with the national average on its Gross Profit / Capital Employed.
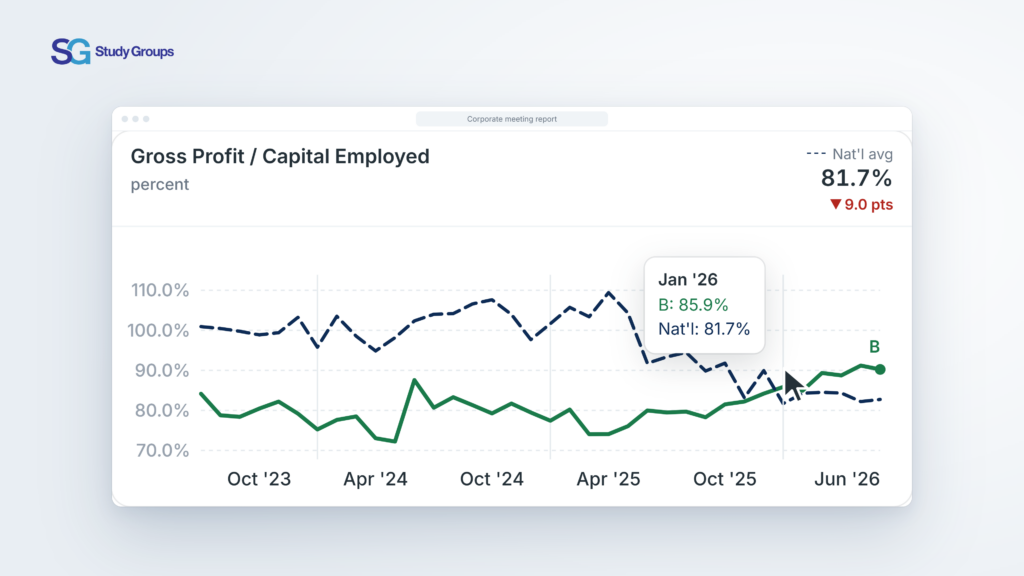
Figure 1: Gross Profit/Capital Employed, Company B compared with the national benchmark over time.
Gross Profit / Capital Employed measures the percentage of gross profit a company generates each year for each dollar of capital employed. This metric represents both balance sheet efficiency and margins. In mid-2024, Company B was generating about 72 cents in gross profit for every dollar of capital employed. At the same time, the national average was closer to 97 cents in gross profit for every dollar of capital employed. Over the next two years, Company B improved this metric, while the national average weakened. Looking at Company B’s trend over time, compared with the national average, tells a much richer story than looking at the most recent number alone.
The numbers can point to where a gap exists, but they usually can’t explain why. That’s where conversations with other operators come in. When Meyer Oil compared its results with operators of equivalent size, the group average, top performers, and national benchmarks, the data showed a few areas worth a closer look. Talking with peers about how they handle hiring, scheduling, and merchandising helped shape changes the company went on to make. Rather than copying another operator, they took ideas that had worked elsewhere and adapted them to fit their own business.
Knowing your numbers is still the starting point. Seeing them alongside your peers, over time and with the benefit of other operators’ experience, is what tends to turn that information into better decisions. For many members, the relationships end up mattering as much as the data. As Meyer put it, “Those friendships will outlast my career.”
Put Your Benchmarking to Work
Before your next Study Group meeting, identify one metric you want to improve and bring it to the group. Look at your trend, compare it with your peers, and ask the members performing well what is behind their results. Don’t just review the benchmark. Use it to start a conversation. The more you bring to your group, the more you can learn from the experience sitting around the table.